INSTITUTE INDEX: New Orleans six years after Katrina
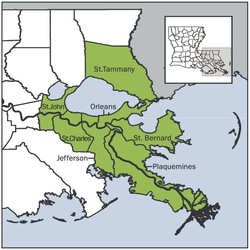
 Today marks six years since Hurricane Katrina made landfall along the Gulf Coast, leading to the catastrophic failure of the federal levee system in and around New Orleans. While the metro area has made great progress in recovering from the unprecedented disaster, serious socioeconomic problems remain, as the following numbers show. All of the figures are from the Greater New Orleans Community Data Center's New Orleans Index at Six. The map of the metro area is also from the report. For more numbers related to the disaster, see Katrina Pain Index 2011: Race, Gender, Poverty.
Percent of the New Orleans metro area that was left underwater by Hurricane Katrina and the levee failures in August 2005: 80
Percent decline in New Orleans' population between 2000 and 2010: 29
Percent of jobs lost in New Orleans metro area from 2008 to 2010: 1.2
Percent of jobs lost nationally in that period: 5.1
Percent average wages in the New Orleans area increased from 2000 to 2004: 7
Percent average wages there increased from 2004 to 2006: 14
Number of individuals starting businesses out of every 100,000 adults in the New Orleans area from 2003 to 2005: 218
From 2008 to 2010: 427
National average: 333
Percent change in median household income in the New Orleans metro area from 1999 to 2009: 0
Percent change in median household income nationally during that same period: -7
Percent by which incomes in the New Orleans area trailed national incomes in 1989: 19
Percent by which they trail national incomes today: 8
Factor by which the number of low-income households in New Orleans exceeds the number of high-income households, a figure that has remained basically unchanged since 1979: 2
Percent of black households in the New Orleans metro area that were upper-income in 1999: 7
Percent in 2009: 5
Factor by which black households in New Orleans are more likely than white households to be low-income: 2
Percent of Orleans Parish students who attended academically satisfactory schools in 2003: 28
Percent who attended such schools in 2010: 68
Percent of adults in both the U.S. and New Orleans area who held a bachelor's degree in 1990: 20
Percent of New Orleans metro area residents who hold a bachelor's degree today: 26
Percent nationwide: 28
Percent of African-Americans in the New Orleans metro area with a bachelor's degree in 2009: 15
Percent of African-Americans nationwide with a bachelor's degree in 2009: 18
Percent less that African-American households in the New Orleans metro area earn compared to white households: 50
Percent less than Hispanic households in the New Orleans metro area earn compared to white households: 30
Percent of New Orleans renters who paid more than 35 percent of their pre-tax household income on rent and utilities in 2004, a level considered unaffordable: 43
Percent who did so in 2009: 55
Percent by which New Orleans' violent crime rate, though down since before Katrina, still surpassed the national average in 2009: 80
Percent of coastal wetlands protecting the New Orleans metro area that have been converted to open water since 1932, making future storms all the more threatening: 29
Tags
Sue Sturgis
Sue is the former editorial director of Facing South and the Institute for Southern Studies.
