Map Mischief: How gerrymandering has undercut Southern Democrats in Congress
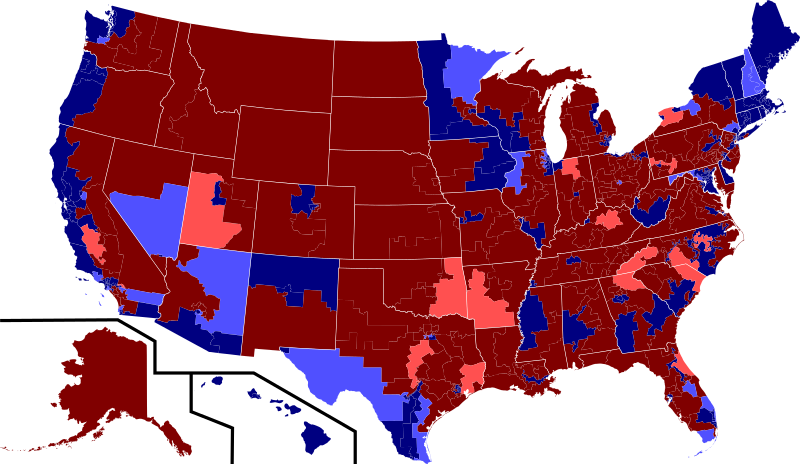
In North Carolina, more than half (51 percent) of the state voted in 2012 for a Democrat to represent them in Congress. But this month, less than a third (31 percent) of the U.S. Representatives who will be sworn into office from North Carolina will be Democrats.
The mismatch between votes and representation is even more striking in South Carolina, where more than 40 percent of the state's voters chose a Democratic representative, but only one of the state's seven-member delegation is a Democrat.
In Arkansas, nearly 30 percent of voters picked a Democrat for the U.S. House. The number of Democrats who will represent Arkansas? Zero.
Such is the power of gerrymandering, where the majority party in state legislatures use the once-a-decade redistricting process to draw Congressional maps to their benefit. Gerrymandering, of course, is a national phenomenon, used by both parties throughout history to maintain their political advantage.
But a new analysis by the Institute for Southern Studies finds that the mismatch gerrymandering has created between voters' choices and who represents them in Congress is especially strong in the South.
As Republican have come to dominate Southern state legislatures, they have seized the opportunity to design districts which are particularly effective at minimizing the ability of Democrats to compete in Congressional races.
As a result, the gap between the number of voters who vote Democratic for Congress and the actual number of Democratic representatives who will take office this month is four times greater in the South than the national average -- a situation that exaggerates the power of Republicans in the South and fuels perceptions of the region as a monolithic conservative stronghold.
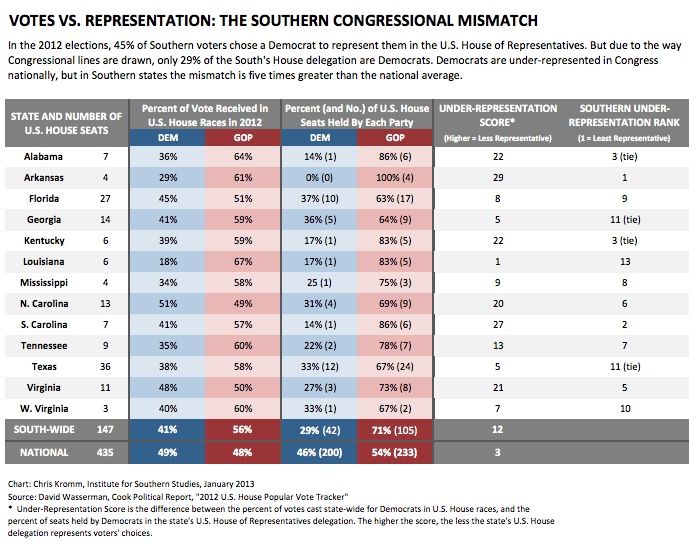
To measure the mismatch between votes and representation in Southern states, the Institute compared the popular vote totals in congressional races, using David Wasserman of the Cook Report's 2012 U.S. House Popular Vote Tracker. Then, the Institute compared the statewide voting results to each Southern state's U.S. House delegation, coming up with an "Under-Representation Score" -- the difference between the percent who voted for a Democrat in the U.S. House and the actual percentage of Democrats representing each state.
Among the findings of the Institute's analysis:
* In 2012, 41 percent of voters in 13 Southern states voted for a Democrat to represent them in the U.S. House of Representatives. Yet only 29 percent of the South's delegation to the U.S. House are Democrats -- a 12-point mismatch.*
* Democratic voters in the South are four times more likely to be under-represented in Congress than the national average. Forty-nine percent of voters nationwide chose a Democrat for the U.S. House in 2012, while 46 percent of Congress' lower chamber are Democratic -- a 3-point difference, compared to the 12-point gap in Southern states.
* Arkansas scores the highest for under-representing Democratic voters among Southern states. While 29 percent of Arkansas voters chose a Democrat for Congress, none of the state's U.S. Representatives will be Democrats -- a 29-point "under-representation score."
* Alabama, Kentucky, North Carolina, South Carolina and Virginia all have under-representation scores of 20 or more.
* Among Southern states, Louisiana has closest alignment between the choices of its voters and the makeup of its Congressional delegation. In 2012, 18 percent of Louisiana voters chose a Democrat for the U.S. House; in Washington this month, 17 percent of representatives being sworn in to Congress will be Democrats.
In no Southern state are Democrats over-represented in Congress, compared to their 2012 vote totals. Here is a chart of the Institute's findings (for a larger version, click here):
* UPDATE: An earlier version reported that the South-wide total of Democratic votes for U.S. House as 45%; the correct figure is 41%. All related figures have been updated to reflect this correction.
Tags

Chris Kromm
Chris Kromm is executive director of the Institute for Southern Studies and publisher of the Institute's online magazine, Facing South.