Picture this: The geography of immobility
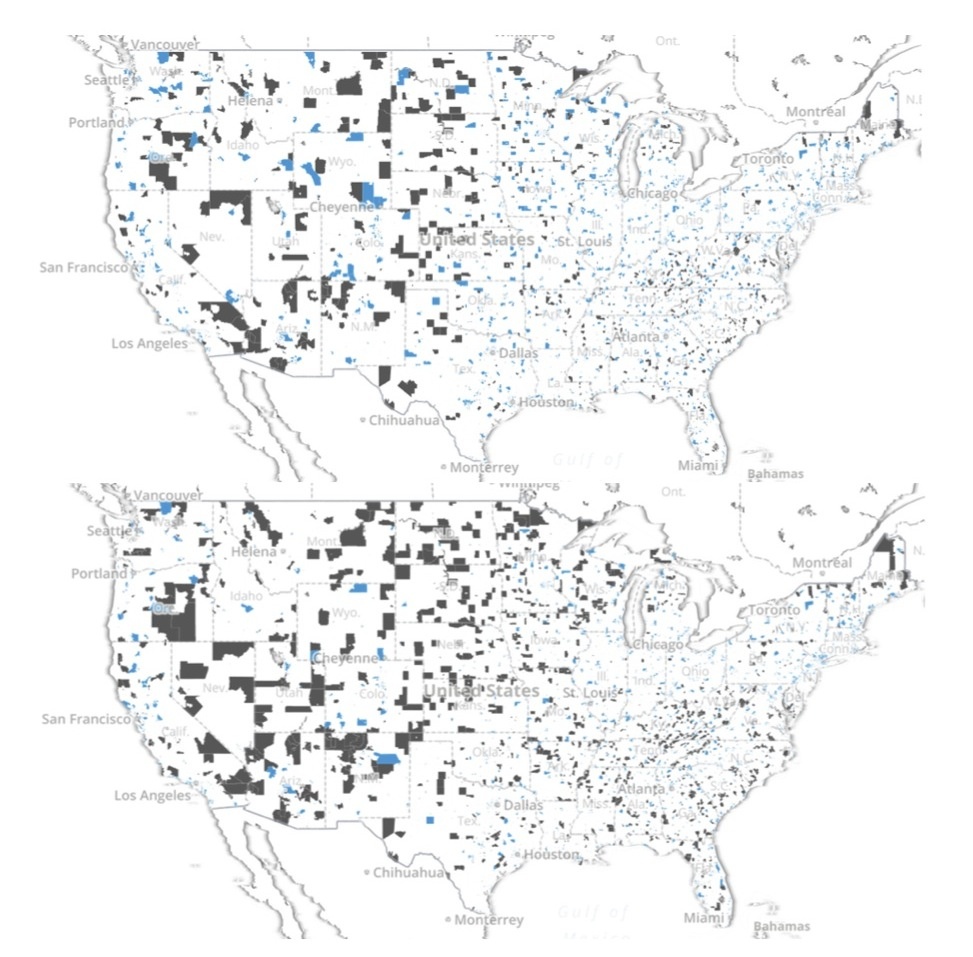
The maps show the top 10 percent (in blue) and bottom 10 percent (in black) of economically advantaged census tracts for 1990 (top) and 2010 (bottom). The bottom 10 percent has shifted and spread, especially in the South and West. (Maps from the Urban Institute; for larger versions click here.)
By Alyson Zandt, MDC
Residential segregation is a huge barrier to an equitable infrastructure of opportunity in the U.S., because where you live has a major impact on your access to a quality education and good jobs. In the South, the typical metro resident can only access 26 percent of that metro's jobs within 90 minutes via transit — lower than any other region. For suburban residents in the South, it's less than 20 percent. And jobs near high-poverty neighborhoods have declined substantially since 2000 in most U.S. and Southern metros, especially for many high-poverty suburban Southern neighborhoods.
We talked last week about the importance of reducing housing discrimination as one step toward reducing economic and racial segregation in neighborhoods. Thanks to a new interactive map from the Urban Institute (via CityLab), we can examine patterns of affluence across the U.S. The map shows where the Census tracts with the highest and lowest socio-economic status are located, with socio-economic status determined by income, educational attainment, homeownership, and housing value. Take a look below at the eight Southern metros that have some of the lowest levels of economic mobility in the U.S. Census tracts in the top 10 percent of socio-economic status are blue, while those in the lowest 10 percent are gray.
These Southern metros show clear divisions or clusters of affluence, which implies that resources and opportunity are concentrated in certain areas. That concentration makes it much more difficult for those living outside affluent areas to access affordable housing, jobs, and social networks that are key factors in economic mobility. We can see the picture much more clearly now — what will we do to change it?
Memphis, TN:
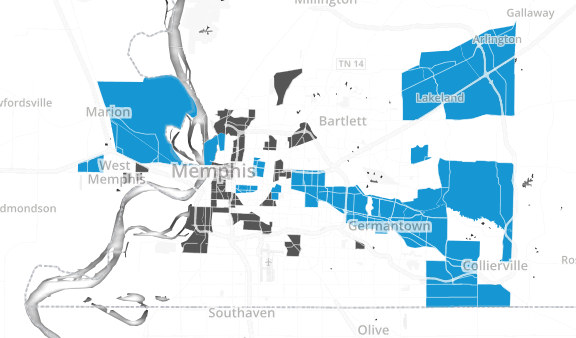
(Source: Urban Institute)
Charlotte, NC:
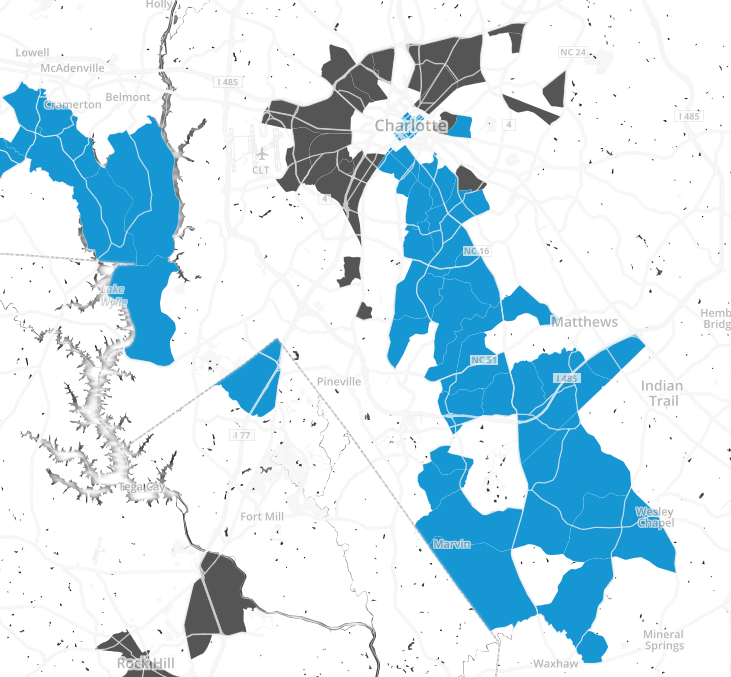
(Source: Urban Institute)
Columbia, SC:
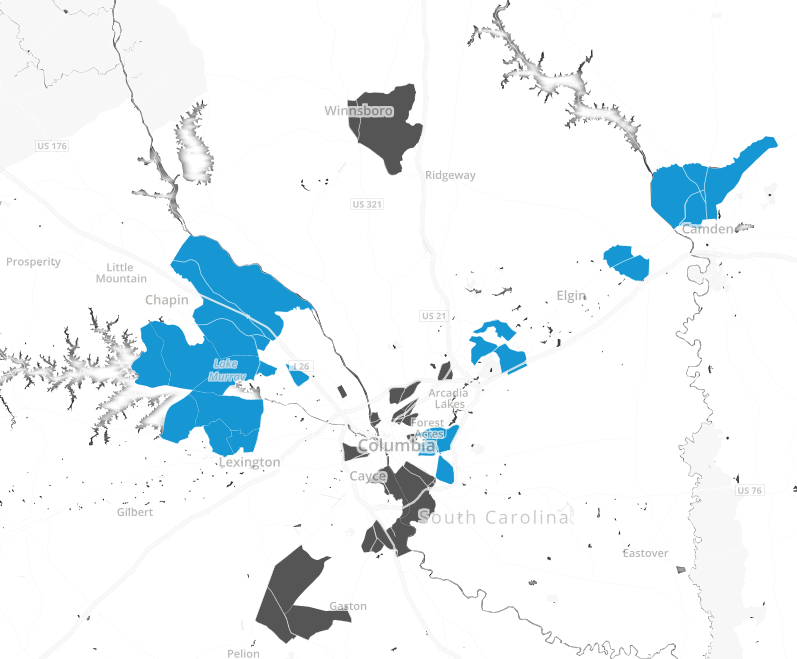
(Source: Urban Institute)
Atlanta, GA:
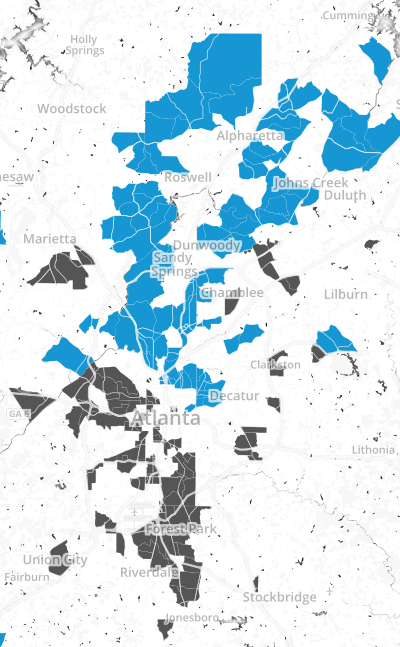
(Source: Urban Institute)
Greensboro, NC:
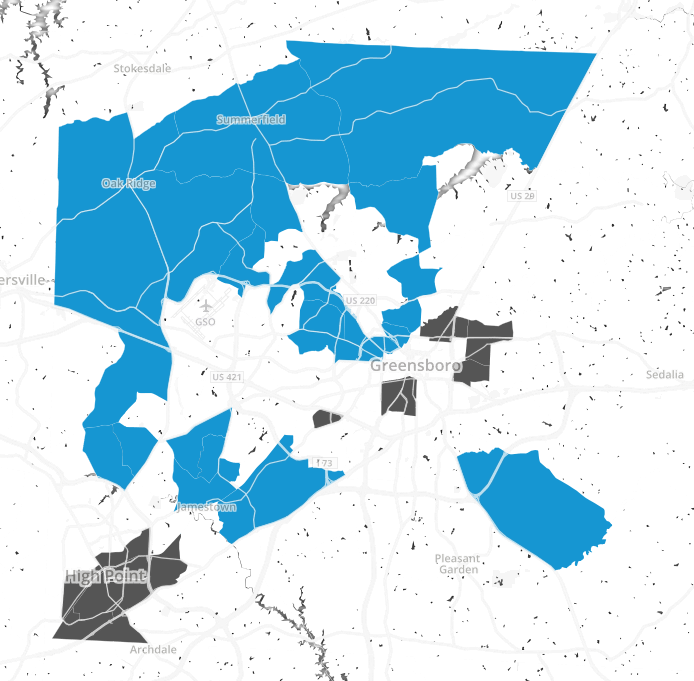
(Source: Urban Institute)
Raleigh, NC (and neighboring Durham):
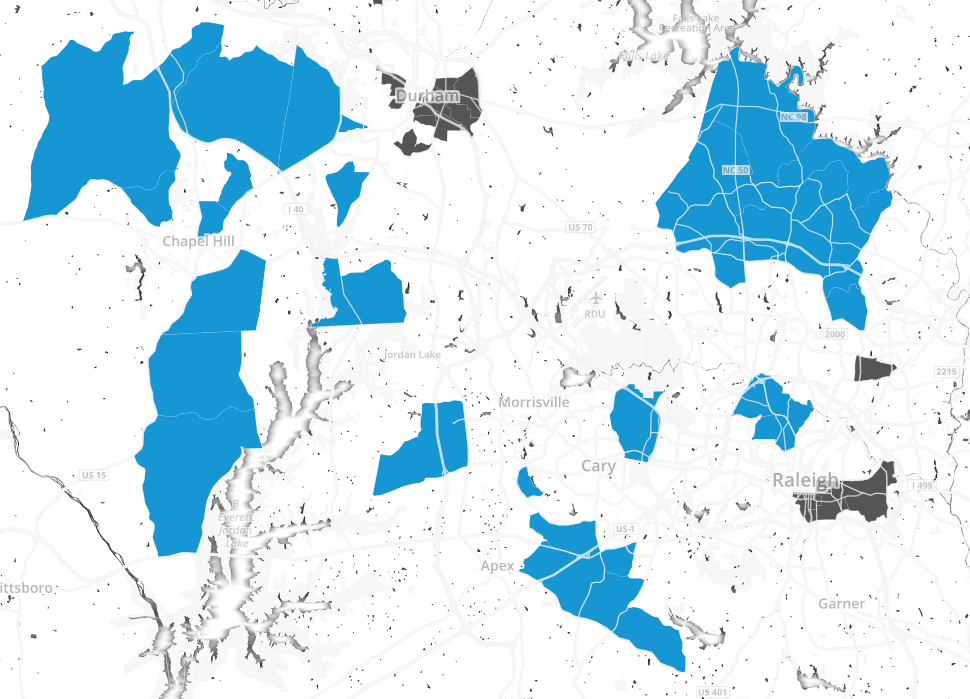
(Source: Urban Institute)
Greenville, SC (and neighboring Spartanburg):
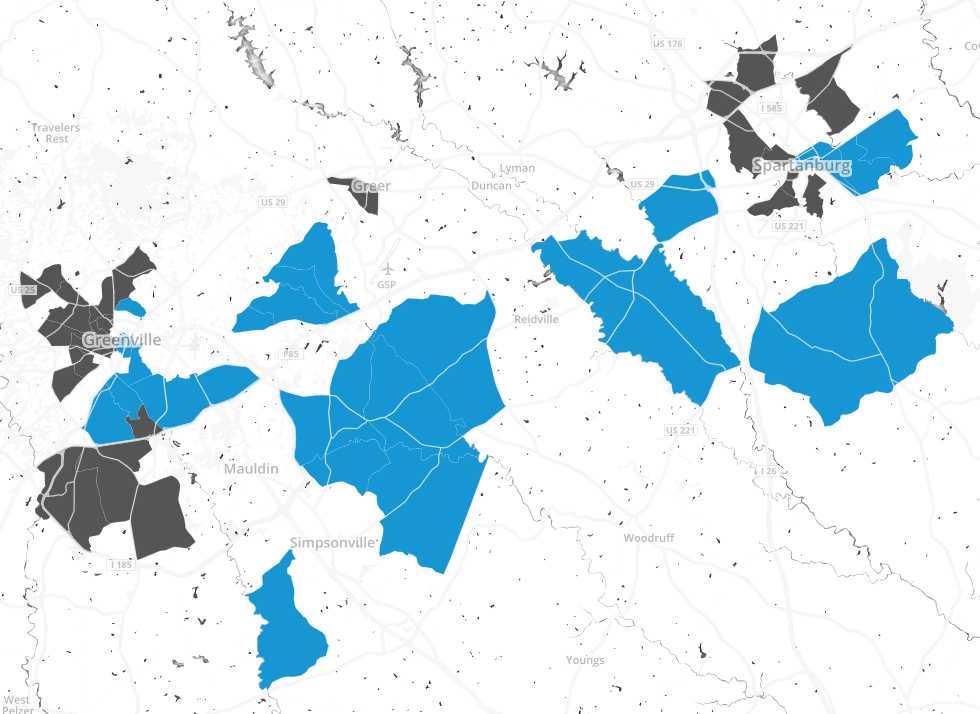
(Source: Urban Institute)
Jacksonville, FL:
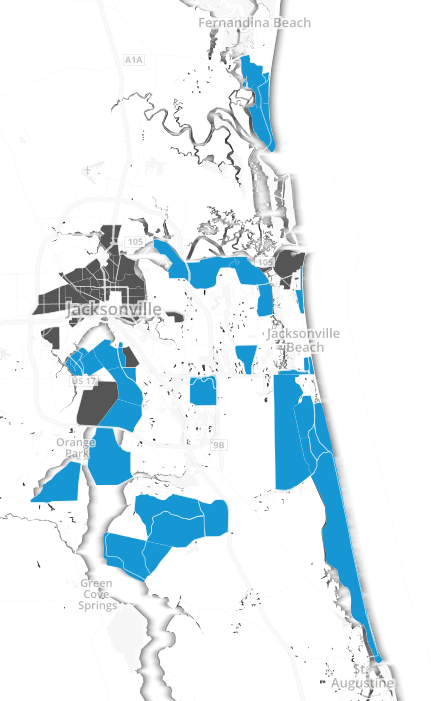
(Source: Urban Institute)