Shedding light on the legacy of segregation in North Carolina
As attorneys with the University of North Carolina's Center for Civil Rights carried out their work of advocating for low-wealth and minority communities across the state, they witnessed the same injustices crop up time and time again -- environmental, educational, economic.
"We recognized that the same patterns of exclusion were repeating, in denial of water and sewer, exclusion from quality schools, and being burdened with landfills, but our evidence was based on our limited experience with individual communities," says center attorney Peter Gilbert, who has worked closely with so-called "underbounded" communities excluded from nearby municipalities and the services they provide.
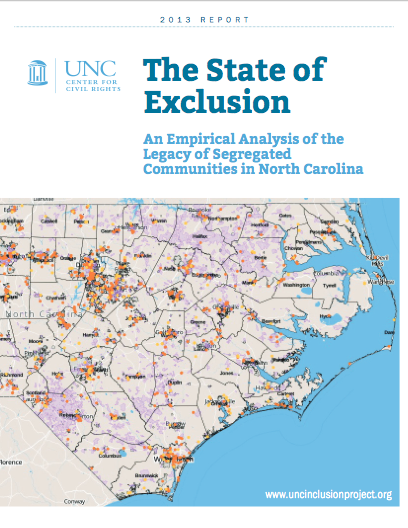
Last year, Gilbert and colleagues set out to take a systematic look at what was happening in underbounded and other socially, politically, and economically marginalized communities statewide. Their work has resulted in an eye-opening report released last week titled "The State of Exclusion: An Empirical Analysis of the Legacy of Segregated Communities in North Carolina."
Gilbert and other center staff studied data from the 2010 U.S. Census to identify potentially excluded communities. They began by determining every census block in the state that was at least 75 percent non-white -- African American or Native American -- or Latino and then grouped the contiguous communities into clusters. (A census block is the smallest geographic unit used by the Census Bureau for tabulating data collected from all homes rather than a sample of homes.)
They then examined the clusters of exclusion and measured and mapped the potential for inequality in five areas: environmental justice, voting rights, housing, municipal services and education. In all, they studied nearly 3,200 clusters and documented dramatic disparities between more integrated and more segregated communities.
Among their findings:
* Residents of majority African-American clusters are nearly twice as likely as state residents overall to live within a mile of a solid waste facility. The exposure rate to such facilities is 5.34 percent for all North Carolinians, but that figure jumps to 10.36 percent for residents of African-American clusters.
* While about 24 percent of all North Carolinians live within a mile of an Environmental Protection Agency-registered polluter, 41 percent of residents of Latino clusters and 44 percent of residents of African-American clusters live within a mile of such pollution sources.
* The closest elementary school for over 63 percent of all North Carolina residents is racially identifiable, with a 10 percent or more racial disparity from the county average. But for the 1 million residents of the state's African-American clusters, that figure is over 80 percent, and the disparity increases with the wealth of the county.
* Statewide, 19 percent of residents live where the closest elementary school has a rate of passing end-of-grade tests of less than 50 percent, but that figure more than doubles for residents of all clusters to 46 percent.
* While just over 33 percent of all North Carolina residents live where the closest elementary school is high-poverty -- meaning at least 10 percent more students qualify for free or reduced-price lunch than the county average -- that number almost doubles for residents of Latino clusters and more than doubles for residents of African-American clusters.
* Majority Latino clusters have slightly higher rates of manufactured housing than the state average of 14.26 percent, and almost half of all homes in Native American clusters are manufactured.
* While less than one-third all all North Carolinians live in rental housing, more than half of all cluster residents live in rental units.
The authors say there was insufficient data to draw strong conclusions about infrastructure such as sewer and water service and political exclusion.
The 44-page report and the accompanying interactive online map represent the first phase of what the Center is calling the Inclusion Project. The second phase, launched in June, is examining 20 of North Carolina's 100 counties in greater detail. In the third and final phase, the center will research individual communities in those 20 counties with site visits, interviews and documenting histories from the community perspective.
"We hope the map and the report will enable communities to document the effects of racial exclusion in their community," says Gilbert. "We also hope that policy makers, municipalities and advocates will be convinced by the report to take steps to address the documented impacts of exclusion, and the gaps we identified in the availability of critical data."
Tags

Sue Sturgis
Sue is the former editorial director of Facing South and the Institute for Southern Studies.