NC leads nation in surge of people living in high-poverty areas
After declining between 1990 and 2000, the portion of the U.S. population living in high-poverty communities grew significantly in the past decade -- and most dramatically in North Carolina.
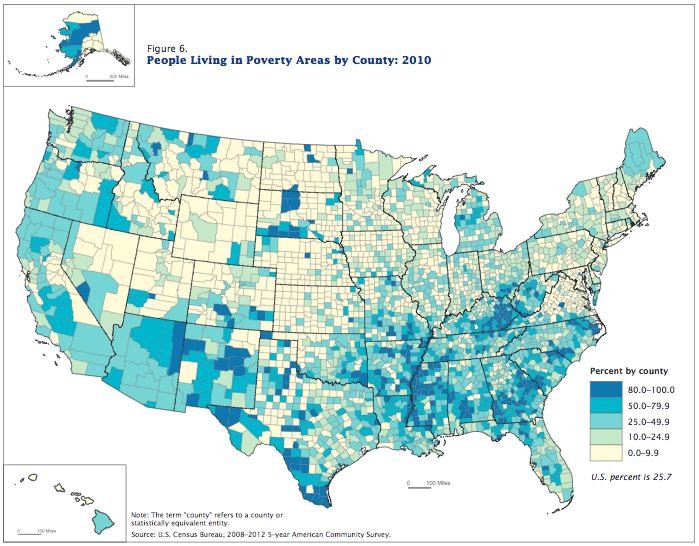
That's among the findings of a new Census Bureau report that looked at changes in areas with concentrated poverty between 2000 and 2010. The Census Bureau defines a "poverty area" as a census tract with a poverty rate of 20 percent or more.
According to the report:
Between 1990 and 2000, the percentage of people living in poverty areas fell from 20.0 percent to 18.1 percent. This trend was reversed in the past decade. Between 2000 and 2010, the percentage of people living in poverty areas grew from 18.1 percent to 25.7 percent. While the overall population grew by 10 percent over the decade, the number of people living in poverty areas grew by about 56 percent.
Nationally, about 77 million people or 25.7 percent of the U.S. population lived in poverty areas in 2010. Of the 45 million U.S. residents in poverty, more than half lived in high-poverty areas in 2010.
 Among the four main U.S. regions, the Midwest had the greatest increase in people living in poverty areas from 2000 to 2010, at 9.8 percent. It was followed by the South at 9 percent, the West at 5.9 percent, and the Northeast at 3.3 percent.
Among the states, the increase in people living in poverty areas was greatest in North Carolina, at 17.9 percent, followed by Tennessee and Oregon, both at 16 percent, Arkansas at 15.7 percent, Georgia at 14.6 percent, and South Carolina at 14.4 percent. The maps at left, which are from the report, offer a state-by-state comparison from 2000 to 2010; for a larger version, click here.
The only states where both the number and proportion of people living in poverty areas declined between 2000 and 2010 included two in the South -- Louisiana and West Virginia, at -3.6 percent and -2.3 percent, respectively -- and the District of Columbia, at -6.7 percent.
Today over half of black Americans -- 50.4 percent -- live in high-poverty areas, up from 46.3 percent in 2000, the report also found. The percent of Hispanics, who can be any race, living in poverty areas also increased over that period from 40.4 percent to 44.1 percent. The percentage-point increase in the portion of people living in poverty areas was greatest for whites, from 11.3 percent in 2000 to 20.3 percent in 2010.
"Various researchers have found that living in communities with a large concentration of people in poverty adds burdens to low-income families," the report states. "Problems associated with living in poverty areas, such higher crime rates, poor housing conditions, and fewer job opportunities are exacerbated when poor families live clustered in high-poverty neighborhoods."
For the full report and more maps and tables analyzing the data, click here.
Tags

Sue Sturgis
Sue is the former editorial director of Facing South and the Institute for Southern Studies.