INSTITUTE INDEX: How states' elections changes imperil the Latino vote

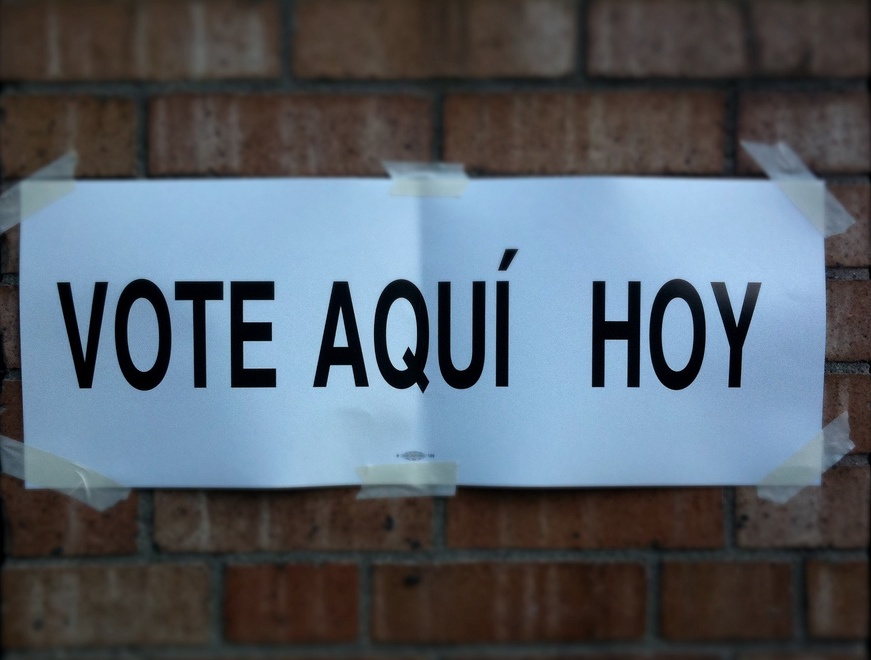
Latinos heading to the polls this year will face new obstacles to voting. (Photo by Dan Dickinson via Flickr.)
Number of states or portions of states that had to obtain Justice Department preclearance in order to implement new voting policies at the time of the last presidential election, a policy that ended when the U.S. Supreme Court gutted a key provision of the Voting Rights Act in its 2013 Shelby v. Holder decision: 16
Number of Latino voters living in the jurisdictions that lost preclearance: 8 million
Of these 8 million voters, number who are likely to find it more difficult to cast ballots because of state laws implemented since the last presidential election: 875,000
Since that election, number of states that have implemented new laws that make it harder for Latinos to vote: 19
Of the nine states that saw their Latino populations increase by at least 100 percent between 2000 and 2010, number that implemented restrictive new voting changes since 2012: 6
Of those six states, percent in the South: 100*
Number of states that will have some form of voter ID requirement in place for the upcoming election: 33
In Mississippi, number of Latinos who are otherwise eligible to vote but likely lack a needed form of ID: 4,700
In Alabama: 10,800
Virginia: 45,600
Georgia: 46,100
Texas: 771,300
Percent of registered Latino voters in Texas's 23rd Congressional District who did not vote in 2014 because they believed they could not meet the state's voter ID requirements: 6
Number of eligible Latino voters in North Carolina who could have preregistered as 16- and 17-year-olds in 2014 if the legislature had not passed its restrictive voting law immediately after Shelby v. Holder: 18,000
Number of bipartisan bills that have been introduced in Congress to restore the section of the Voting Rights Act gutted by the Supreme Court's decision: 2
Number of those bills that have advanced to date: 0
* Alabama, Arkansas, Kentucky, Mississippi, North Carolina, and Tennessee.
(Click on figure to go to source. Many of the numbers in this index are drawn from "Latino Voters at Risk: Assessing the Impact of Restrictive Voting Changes in Election 2016" by the NALEO Education Fund.)
Tags
Rebekah Barber
Rebekah is a research associate at the Institute for Southern Studies and writer for Facing South.
