Big Southern metros grow more diverse but neighborhood integration lags
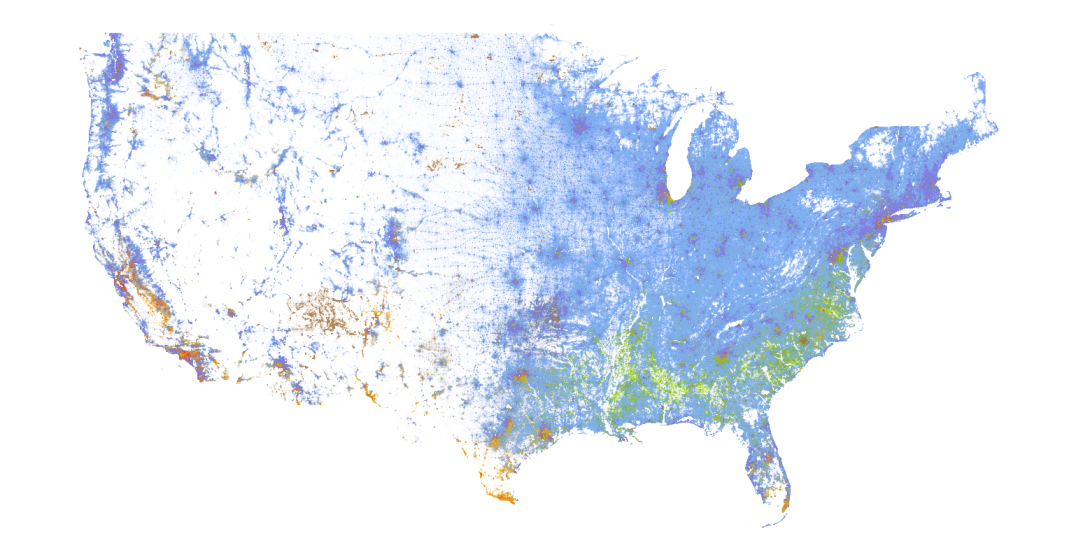
The more than 308 million dots on the map above represent people in the U.S. based on the 2010 census, according to the University of Virginia's Weldon Cooper Center for Public Service. People who identify as white are shown in blue dots; African Americans in green; Asians in red; Hispanics in orange; and other racial groups in brown, according to the center. (Image Copyright, 2013, Weldon Cooper Center for Public Service, Rector and Visitors of the University of Virginia. Used with permission.)
The U.S. is becoming more racially and ethnically diverse and approaching a multiracial and multi-ethnic, majority-minority future. By 2045, white people are expected to make up 49.7% of the U.S. population; Hispanics, 24.6%; Black people, 13.1%; Asians, 7.9%; and multiracial Americans, 3.8%, according to William Frey's analysis of census projections for the Brookings Institution. Driving this demographic change are the natural decrease in the white population (more deaths than births), a natural increase among minority groups, immigration, and a growing number of mixed-race Americans.
The South* is no exception to this trend. The region is diversifying at a slower rate than the Midwest and Northeast, the least diverse regions, according to a 2019 report by ESRI, a mapping and data analytics group. But the South is already the second most diverse region, behind the West but ahead of the country overall.
In Texas, white people ceased being the majority of the population in the early 2000s. Today, Hispanics in the Lone Star state make up around 40% of the population, Black residents 13%, and white residents 41%. Also close to a majority-minority tipping point in the South are Georgia and Florida, where white residents currently make up around 52% and 53% of the states' populations respectively.
As of the 2010 census, the South's five most populous metropolitan areas — Dallas; Houston; Alexandria, Virginia; Atlanta; and Miami — were also majority-minority or very close.
To better understand the racial and ethnic diversity of these Southern metros, we used data gathered by the Portland-based think tank City Observatory. They used a racial and ethnic diversity index called REDI to give the 52 most populous metros a diversity score. The index accounts for five demographic groups: non-Hispanic white, non-Hispanic Black, non-Hispanic Asian, Hispanic, and those who identify as more than one race. The higher the REDI score, the greater an area's diversity; it ranges from 0, if an area's population identifies with just one group, to 80, if an area's population is divided evenly between all five groups.
Among the South's five most populous metro areas, Arlington has the highest REDI score at 70.7, with Houston coming in a close second at 70, Dallas at 68.3, Atlanta at 66.9, and Miami at 64.4. In other words, the chance of randomly selecting two locals who are from different demographic groups is about 71% in the Arlington area and just over 64% around Miami.
But despite the trend toward more diversity in the South's most populous metros, their residents aren't necessarily living in neighborhoods that reflect that diversity.
The City Observatory also measured the diversity of urban tracts, which are areas within metros that have more than 640 people per square mile. Think of them as neighborhoods. The graphic below shows the REDI scores for the median urban tracts within the South's five most populous metros. The median urban tract is the neighborhood whose REDI score separates the bottom and top half of neighborhoods when ordered from lowest to highest REDI. Think of a median urban tract as a typical metro neighborhood.
By dividing the REDI score of a typical neighborhood by the REDI score of its metro, we get a measurement of residential integration. Hover over the graphic below to see how close the five most populous Southern metros have come to fully integrating. The most and least integrated metro areas among the 52 most populous, Seattle and Cleveland respectively, are shown for comparison.
This graphic shows that it's possible for a metro to have lots of diversity but for its typical neighborhood to have less. It's also possible for a metro to have lower levels of diversity but for its neighborhoods to be more integrated. So while the Arlington metro area, for instance, has a REDI score of 70.7, the typical Arlington area neighborhood has a REDI score of 58. In the 52 most populous U.S. metros, the typical urban neighborhood has a REDI score of 49, according to the City Observatory.
The cost of segregation
There isn't a single answer for why the South's most populous metros have failed to fully integrate.
One possible explanation for segregation's persistence in neighborhoods across the region and country is systematic discrimination in the housing market. For example, a recent investigation by Reveal from The Center for Investigative Reporting found that African Americans and Latinos are routinely turned away from conventional mortgage loans at rates far higher than their white peers despite a federal ban on racial discrimination in lending. The practice may contribute to residential segregation by keeping minorities out of certain neighborhoods while letting a significant number of white residents in. Reveal calls the practice "modern-day redlining" — referring to the historic practice of lenders coloring portions of a map red to indicate areas they designated as "hazardous" for making loans— and says it has persisted in 61 metro areas, with African Americans facing the most resistance in Southern cities.
Hispanics and Asians are less segregated than African Americans in the U.S., according to a 2011 study on the persistence of metro segregation by researchers John Logan of Brown University and Brian Stults of Florida State University. They say there is evidence that individual success has led Hispanic and Asian group members to move out of ethnic neighborhoods. But because these groups continue to grow rapidly, their "rate of mobility out of ethnic neighborhoods is not sufficient to overcome the inflow into them," according to the study.
Measuring the precise impact of residential segregation is also complicated. But in a 2017 study titled "The Cost of Segregation," the Urban Institute and the Metropolitan Planning Council of Chicago analyzed data from the 1990, 2000, and 2010 censuses on the 100 most populous commuting zones, which they say are similar to metro areas. Among white, Latino and Black residents in these areas, higher levels of racial segregation were linked with lower incomes for Black residents, lower educational attainment for white and Black residents, and lower levels of safety for all residents, according to the groups' research.
Regions where Black or Latino communities live far apart from white residents also have higher segregation levels between low- and high- income households. The relationship between racial and economic segregation is stronger when measuring the segregation between Blacks and whites, and weaker when measuring that of Latinos and whites, the groups' research shows.
"High degrees of segregation based on race and class result in stratifying access to education and other public services, opportunities for social interaction, labor market prospects, and health outcomes," the Urban Institute says.
A new federal rule adopted by the Obama administration in 2015 targeted neighborhood segregation nationwide by requiring local governments to address zoning laws or other regulations that effectively discriminate against people of color. But last week, the Trump administration repealed the Affirmatively Furthering Fair Housing rule, with Trump tweeting that he was "happy to inform all of the people living their Suburban Lifestyle Dream that you will no longer be bothered or financially hurt by having low income housing built in your neighborhood." The decision has been widely criticized by civil rights groups, who say it will exacerbate residential segregation.
"The government helped create entrenched, pernicious residential segregation and has an obligation to undo it," said Nikitra Bailey of the Center for Responsive Lending in Durham, North Carolina. "By rejecting the Fair Housing Act's mission to dismantle segregation and the inequity it created, this Administration is eschewing its responsibility and will be on the wrong side of history."
* Facing South defines the region as including Alabama, Arkansas, Florida, Georgia, Kentucky, Louisiana, Mississippi, North Carolina, South Carolina, Tennessee, Texas, Virginia, and West Virginia.
Tags

Rolando Zenteno
Rolando Zenteno is the inaugural recipient of the Julian Bond Fellowship with Facing South.