The changing face of Southern voters
One of the biggest stories coming out of the 2012 elections was the changing demographics of U.S. voters. The increasing racial diversity of the nation's electorate was key to President Obama's victory -- and cast growing doubts on the long-term viability of a Republican Party if it continued to draw its strongest support from whiter and older voters.
The Pew Research Center broke down the numbers in its post-election analysis:
Overall, Obama benefited from relatively strong turnout -- both nationally and in key battleground states -- among young people and minorities ... African Americans, Latinos and Asian Americans backed Obama by huge margins.
Nationally, nonwhite voters made up 28% of all voters, up from 26% in 2008. Obama won 80% of these voters, the same as four years ago.
But how did the new emerging majority fare in the South -- a region which, if viewed only through the lens of Electoral College votes, appears to be a large swath of Republican-voting red?
First, it's important to remember that -- as Facing South has covered before -- the winner-take-all view of red and blue states obscures the South's political reality, which remains deeply purple.
You'd hardly know it from the media frenzy about secession petitions, but in 2012 18.6 million Southerners in 13 states voted for President Obama -- about 45 percent of Southern voters -- compared to 22.6 million for Romney.
And while it's true that Obama's approval ratings lagged the most in Southern states heading into the elections, by Election Day the president's share of the vote in Southern states had dropped by only 1.5 points between 2008 and 2012 -- almost identical to Obama's decline in votes nationally.
But the fact remains that Obama only won two out of the 13 Southern states. So the question remains: What impact did demographic change have in the 2012 elections in the South? And what political clout does the new, emerging majority in the South really have?
Focusing on the big three Southern battlegrounds -- Florida, North Carolina and Virginia -- we have two sources for looking at the electoral clout of the emerging Southern majority. One is the exit polls collected by Edison Research for national media outlets; the other is state voter registration statistics.*
Neither is perfect. The exit polls, which in 2012 included random surveys of voters at the polls as well as phone surveys to account for early voters, are only a rough snapshot of the electorate. The further you drill into the data, the smaller the sample size and the greater the margin of error (already 4 percent for the national figures). Voter registration statistics only tell you who is on the voter rolls, but not if and how they voted.
But together, they offer a glimpse at how demographic changes -- which are happening more quickly in many Southern states than in the rest of the country -- are affecting the Southern political landscape.
The following chart shows how the electorate is changing in the three states:
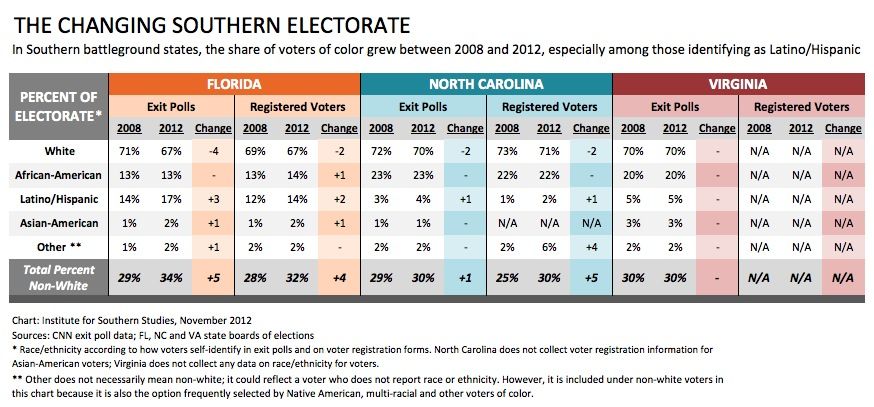
The biggest changes have happened in Florida. According to the exit polls, the number of Florida voters who didn't identify as white grew from 29 percent in 2008 to 34 percent in 2012. That closely parallels the increase in Floridians who marked a race or ethnicity other than white on their voter registration forms -- a 4 percent increase over the same time period.
The increasing racial diversity of the electorate was clearly critical to Obama's victory in Florida in 2012, which he won by less than one point. In such a tight race, winning big margins among African-American voters (95 percent), Latinos (60 percent) and those who identified their race/ethnicity as "other" (59 percent) was decisive.
In 2012, Virginia also ended up falling into Obama's column, but according to the exit poll figures (the only data we have to work with now, because the state doesn't collect voter registration information by race), it wasn't due to a big change in the electorate since 2008. For every racial/ethnic group, the share of the state's voters stayed the same: 70 percent identifying as white, and 30 percent African-American, Latino/Hispanic, Asian-American or other.
While Obama's support among white Virginia voters fell from 39 to 37 percent in the four years since 2008, it was again the high support among African-Americans (93 percent), Latinos (64 percent) and Asian-Americans (66 percent) that propelled him to victory.
And what about North Carolina? Both exit polls and voter registration figures show that the share of white voters declined by two points between 2008 and 2012. Like Florida, the N.C. exit polls showed the share of African-American voters holding steady (which echoes N.C. voter registration statistics), with growth coming mostly from Latino/Hispanic voters.
Interestingly, the exit polls showed 4 percent of N.C. voters identifying as Latino/Hispanic, while they only represent 2 percent of N.C. registered voters. Whether this is due to a high turnout among Latinos or statistical noise in the exit polls remains to be seen. But in a state where white support for Obama dropped to 31 percent, it was Obama's high support among African-Americans (96 percent), Latinos (68 percent) and "others" (52 percent) that kept North Carolina close.
What's the upshot? The Southern electorate is clearly changing -- in different ways and at varying speeds, depending on where you look, but undeniably changing. And while this analysis only looks at three states, these are trends unfolding in every Southern state.
Aside from sheer numbers, the impact that emerging majority voters have in any given Southern state clearly depends on various factors. One is the resources invested in mobilizing them: By one estimate, Obama had more than 100 field offices in Florida, part of a massive investment that helped register and turn out tens of thousands of new majority voters in the state. North Carolina had about half as many offices, and by November the campaign was signaling they were pulling out of the state entirely.
But as with the rest of the country, the question isn't if the Southern electorate is going to profoundly change in the coming years, but by how fast and how much -- with lasting implications for the future of Southern politics.
* Late next year, we'll have the Census Bureau's latest survey on voting, which will supply more data on registration and turnout trends.
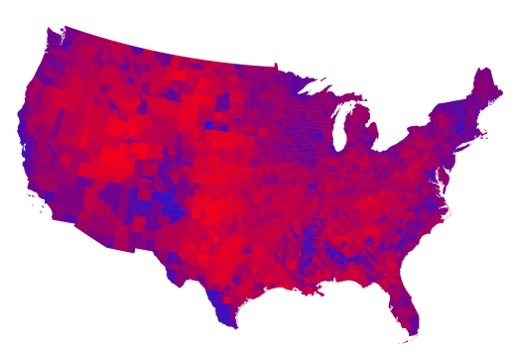
IMAGE: Map of 2012 presidential election results by county, by Mark Newman at the University of Michigan.
Tags

Chris Kromm
Chris Kromm is executive director of the Institute for Southern Studies and publisher of the Institute's online magazine, Facing South.